
It has been sometime since I’ve seen an updated SonarQube tutorial here on DZone, so I thought that I would go through a jump start guide for you. I’m assuming that you are working in one of the common Linux distros (most of this tutorial works as well for Windows, but there are some minor changes. For example, the config file on windows has a .bat extension).
If this tutorial is too much work, then you can head over to SonarCloud. SonarCloud is an online version of SonarQube, and is free for open source projects.
This is not intended to be an in-depth evaluation of SonarQube. You can do that for yourself after you get it up and running. In particular, at the end of this article, I’ll show just a few screenshots of a simple scan. They only hint at the wealth of the information—particularly on drill-down—that the SonarQube GUI provides.
As a note: I am in no way affiliated with SonarSource. I just wanted to explore the functionality of SonarQube.
Step 1: Install Docker
Download Docker here if you’re not running it already, & install it. Docker containers are simply the best way to test out new tools with minimum fuss, in my opinion.
Step 2: Install SonarQube Community and Start It Up
You can do this by running the following 2 commands:1
docker pull sonarqube
2
docker run -d --name sonarqube -p 9000:9000 -p 9092:9092 sonarqube
Now, you can browse to http://localhost:9000, and you’ll be looking at the SonarQube Web GUI.
Easy, right?

Login with: admin/admin. Note the warning in red. This Docker image relies on an embedded H2 database that won’t handle a production environment. If you want to run a more production-like container, and you understand how docker-compose works, then you can find a recipe for adding PostgreSQL as the datastore here.
When you load the SonarQube webpage, you’ll be presented with a tutorial screen. Go ahead and generate a token. I named mine, “my-stinky-php-files.” Very original. Copy this token to your clipboard. We’ll use it later.
Most everyone uses SonarQube to analyze Java files. That’s too easy. For the tutorial, let’s choose a different language. Choose “Other.” Pick your OS. In my case, I’m running Debian Stretch, so I’ll choose, “Linux.” My unique project key will be “my-stinky-php-files.” I happen to have too many of these. Since we are not running this instance in a pipeline, and since we’ll be scanning some PHP code, we will download the CLI scanner. Unzip this into the folder: /opt/sonar-scanner-3.1.0.1141-linux.
You can check out the plugins while you are downloading the required companion scanner software. Note that you may see references to SonarQube Runner. Runner is simply the old name for Scanner.
From this point on we will be working in a Linux environment. Scanners are available for 64-bit versions of Windows, MacOS, Linux, and Any*. Moreover, you can choose to download & install a number of SonarQube scanners depending upon which language(s) you want to analyze or how you want to launch your scanner instances. These include scanners for MSBuild, Maven, Gradle, Ant, and Jenkins.
Now, change to your sonar-scanner/conf directory. For me the path is, “/opt/sonar-scanner-3.1.0.1141-linux/conf”. There is not much to configure. Unless you’ve changed the listening Docker ports you only have to delete the # sign at the start of the sonar.host.url line.1
#----- Default SonarQube server
2
#sonar.host.://localhost:9000
Next, add the Sonar Scanner /bin directory to your path:1
export \ PATH=$PATH:/opt/sonar-scanner-3.1.0.1141-linux/bin
If you want to add this PATH permanently, then make the change in your ~/.profile file. If you don’t do this, you will run into problems later – problems, in the sense that shell will not be able to locate sonar-scanner. You can verify that everything has gone right to this point by opening a new shell (or by sourcing your .profile if you chose that route) and executing the command sonar-scanner -h (on Windows the command is sonar-scanner.bat -h). You will see some usage options.
One last thing to note when running the community edition of SonarQube. As far as I know, there is no way to generate reports as PDF’s or XML. You have to pay for that functionality.
Step 3: Let’s Start Scanning
Let’s see how ugly** my code really is.
When you use SonarQube, sadly you just can’t push a button and send it off to happily scan whatever software you’re evaluating. You have to do a bit of command-line work to get things moving. Fortunately, SonarQube provides you with a default scanning framework that will get you started. However, for most your particular projects you will likely tweak this framework to fit the project. For example, you may want to enter other directories, point to a particular set of Java binaries, etc.
In the case of this tutorial, we’ll go with the simple code that Sonar provides for us.1
/opt/sonar-scanner/bin/sonar-scanner \
2
3
-Dsonar.projectKey= my-stinky-php-files \
4
5
-Dsonar.sources=. \
6
7
-Dsonar.host.://localhost:9000 \
8
9
-Dsonar.xxxxxxxxxxxxxxxxxxxxxxxxxxxxxx
Let’s break this command down.
First, for the Linux-challenged out there, the “\” (space-backslash) command indicates that the command continues over several lines.
/opt/sonar-scanner/bin/sonar-scanner \ initiates the scanning process (If this isn’t in your $PATH, you’ll get an error stating that the file cannot be found)
-Dsonar.-stinky-php-files is a token that describes the set of file(s) that we are scanning. This name must be unique in a given SonarQube instance
-Dsonar.sources=. \ is the location on disk of the files we will scan. If you’re not scanning from the folder that contains your files, provide an absolute path to that location. Replace “\” by “/” on Windows.
-Dsonar.host.://localhost:9000 \ is the URI and port of our SonarQube web GUI
-Dsonar.xxxxxxxxxxxxxxxxxxxxxxxxxxxxxx is the token we generated earlier that uniquely identifies you. This is the point that may befuddle some users when they start running regular scans.
If you intend to run a scan on a different project, or if you’ve had to reload your SonarQube docker instance, or if you’ve simply forgotten your token, go to the web GUI: Click on the administration tab. From there, click on the security drop-down box, and choose Users. If this is your first installation, then you’ll see the Administrator user. To the right of the Groups legend, you’ll see a Token legend. Click on this to generate a new token.
Now, let’s change to the directory that contains the files we want to scan and run the command above. Note, neither your project key nor token will be the same as mine.
Step 4: Now for the Pretty Stuff
If you’ve followed along so far, you’ll see some text run past, and, depending upon the number of files that you scan, it will take a few seconds to a few minutes to complete the scan. If, for some reason you can’t get to the Web GUI, check that the SonarQube container is running by typing: docker ps .
You should see a response similar to that below. If you don’t then you’ll need to restart your container.1
CONTAINER ID IMAGE COMMAND CREATED STATUS PORTS NAMES
2
576c9e4cb65d sonarqube " ./bin/run.sh" 10 hours ago Up 10 hours 0.0.0.0:9000->9000/tcp, 0.0.0.0:9092->9092/tcp sonarqube
When you see “ANALYSIS SUCCESSFUL,” you can head back over to the web GUI.

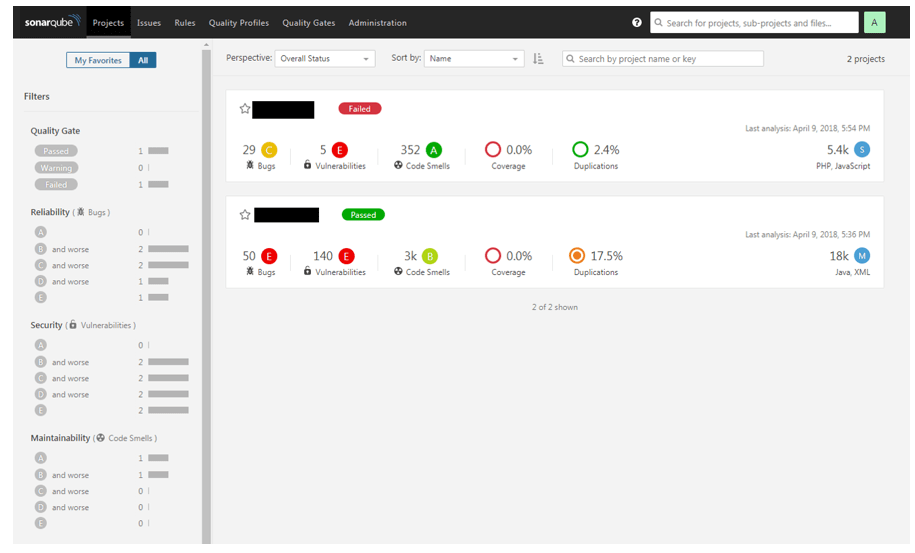
This is the main SonarQube results screen. In this case, I’ve run analyses on two different batches of code—some Java/XML, and some PHP/JavaScript. Since the code is proprietary, I’ve redacted the names in this and the following screenshots. There’s not a lot of detail on this home screen, so let’s take a look at some other screens that show more actionable details.

The code overview visualization. The closer a bubble’s color is to red, the more severe the worst bugs are. Bubble size indicates bug volume, and each bubble’s vertical position reflects the estimated time to address the bugs. Small green bubbles on the bottom edge are best. Hmmmm… Not looking good for this code.

This diagram shows a high-level view of SonarSource’s definition of “maintainability.” Currently, SonarQube measures nine major metrics. The definitions for those metrics can be found here.
The size and color of the bubbles are a reflection of the code smells’ long-term risks. The closer a bubble’s color is to red, the higher the ratio of technical debt is. Bubble size indicates code smell volume, and each bubble’s vertical position reflects the estimated time to address the code smells. Small green bubbles on the bottom edge are best. This diagram explains why the adjective “stinky” is appropriate for this code.

This “Reliability Overview” is a major quality gate metric. It is a general measure of security, and also whether the measured code actually works as the developer intends it to.
SonarSource defines a quality gate as a means to enforce a quality policy in your coding efforts.
It’s there to answer one question: can I deliver my project to production today or not?
SonarSource defines a default quality gate, the Sonar_way. Sonar_way is provided by SonarSource, is activated by default, and represents their view of the best way to implement code quality thresholds. The Sonar_way is a good starting point for determining metrics, but in the real world, it just makes sense to define this depending upon the project, and your organization’s risk appetite.
Step 5: Conclusion
This introduction is just that. There are other ways to run SonarQube both with and without Docker. There are so many ways to customize each particular scan that, really, the only solution is to RTFM. Hopefully, this introduction will get you going. It will allow you to scan some code with SonarQube and visualize the results. Once you get to that point, you will be in a position to drill into the granularity of the SonarQube findings and to determine how best to work these findings into your current development workflows.
Please let me know if you found this quickstart useful. If I have made any errors or not been comprehensible, please let me know as well.
** Sadly, this is production code.


